Archived Nasa Climate Change
@nasaclimatechange·31.2K subscribers·311 videos
OCO-2 Global Visualization (Sept. 2014 - Sept. 2015)
Posted
October 29, 2015
Views
13,766
Likes
34
Comments
24
Engagement
October 29, 2015
13,766
34
24
0.42%
Every word spoken in this episode is indexed. Type any phrase to jump straight to the moment it was said.
Type any word or phrase that may have been spoken. Click a result to seek the player to that exact moment.
Try a name, a topic, or a quoted line
 1:18Now Playing
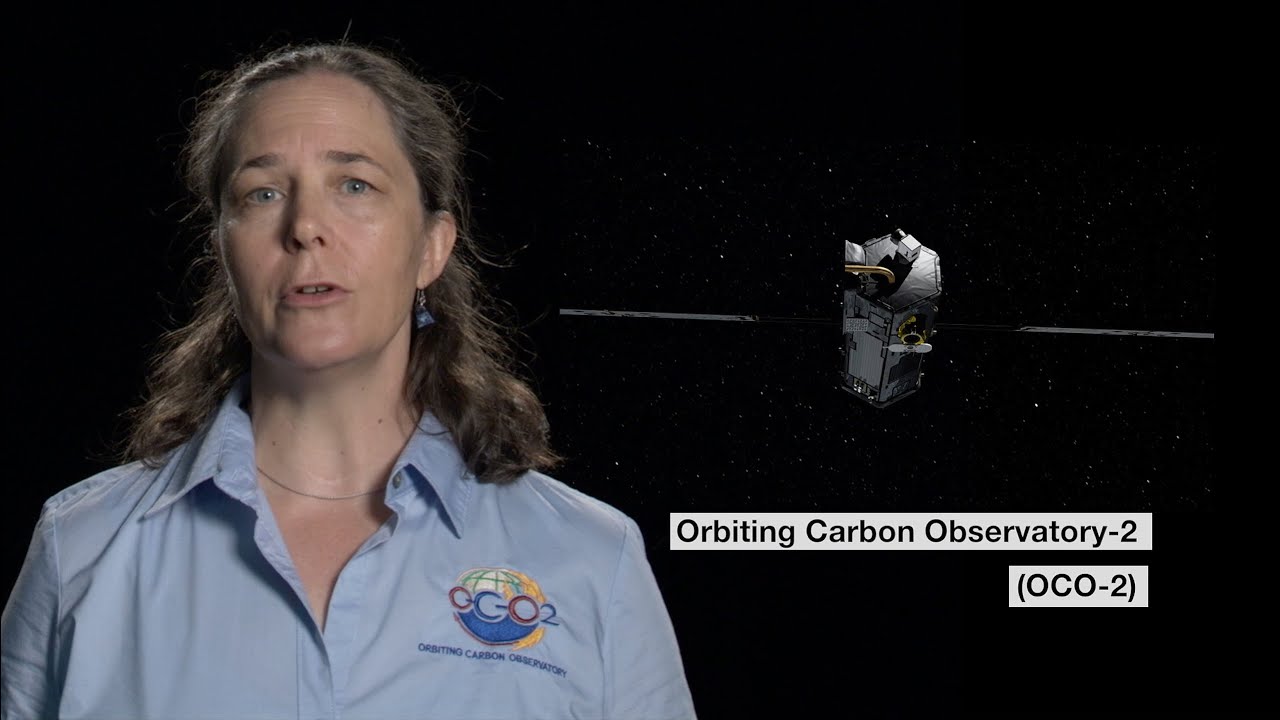
This animation is a global visualization of the first year of carbon dioxide measurements (Sept. 2014 - Sept. 2015) from NASA’s Orbiting Carbon Observatory-2 mission. Each map represents a 16-day cycle and shows average concentrations of carbon dioxide between the top of the atmosphere and Earth’s surface. An increase in carbon dioxide in the northern hemisphere is clearly visible during winter, when trees are not removing carbon dioxide. In spring, the carbon dioxide decreases as trees start to grow.
Sentinel Indexing in Progress
Metadata and chapters are available. Claim extraction for this episode is pending.
All video content is delivered via YouTube embedded players in accordance with the YouTube Terms of Service. Sentinel provides research tools that promote discovery and accountability across political media.