Archived Nasa Climate Change
@nasaclimatechange·31.2K subscribers·311 videos
Climate Simulation of Surface Air Temperature
Posted
January 9, 2020
Views
85,279
Likes
252
Comments
103
Engagement
January 9, 2020
85,279
252
103
0.42%
Every word spoken in this episode is indexed. Type any phrase to jump straight to the moment it was said.
Type any word or phrase that may have been spoken. Click a result to seek the player to that exact moment.
Try a name, a topic, or a quoted line
 0:37Now Playing
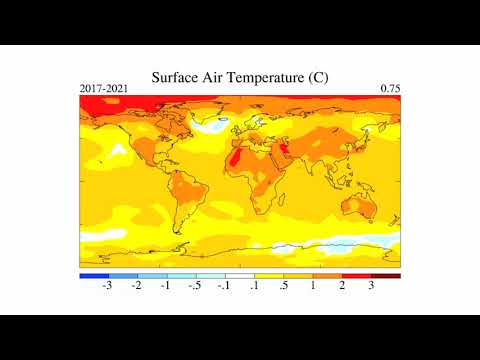
An animation of a GISS (Goddard Institute for Space Studies) climate model simulation made for the United Nations' Intergovernmental Panel on Climate Change Fourth Assessment Report, showing five-year averaged surface air temperature anomalies in degrees Celsius from 1880 to 2100. The temperature anomaly is a measure of how much warmer or colder it is at a particular place and time than the long-term mean temperature, defined as the average temperature over the 30-year base period from 1951 to 1980. Blue areas represent cool areas and yellow and red areas represent warmer areas. The number in the upper right corner represents the global mean anomaly. Credit: NASA’s Goddard Institute for Space Studies
Available for download
Sentinel Indexing in Progress
Metadata and chapters are available. Claim extraction for this episode is pending.
All video content is delivered via YouTube embedded players in accordance with the YouTube Terms of Service. Sentinel provides research tools that promote discovery and accountability across political media.