
Annual Arctic Sea Ice Minimum 1979-2020 with Area Graph
October 19, 2020
76,929
176
48
0.29%
Search the Record
IndexedEvery word spoken in this episode is indexed. Type any phrase to jump straight to the moment it was said.
Type any word or phrase that may have been spoken. Click a result to seek the player to that exact moment.
Try a name, a topic, or a quoted line
Archived Nasa Climate Change Episodes Around October 19, 2020
See what was published immediately before and after this episode.


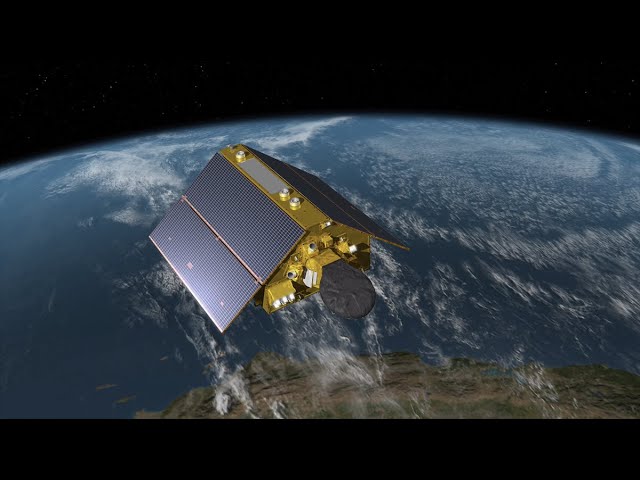


 0:45Now Playing
Annual Arctic Sea Ice Minimum 1979-2020 with Area Graph

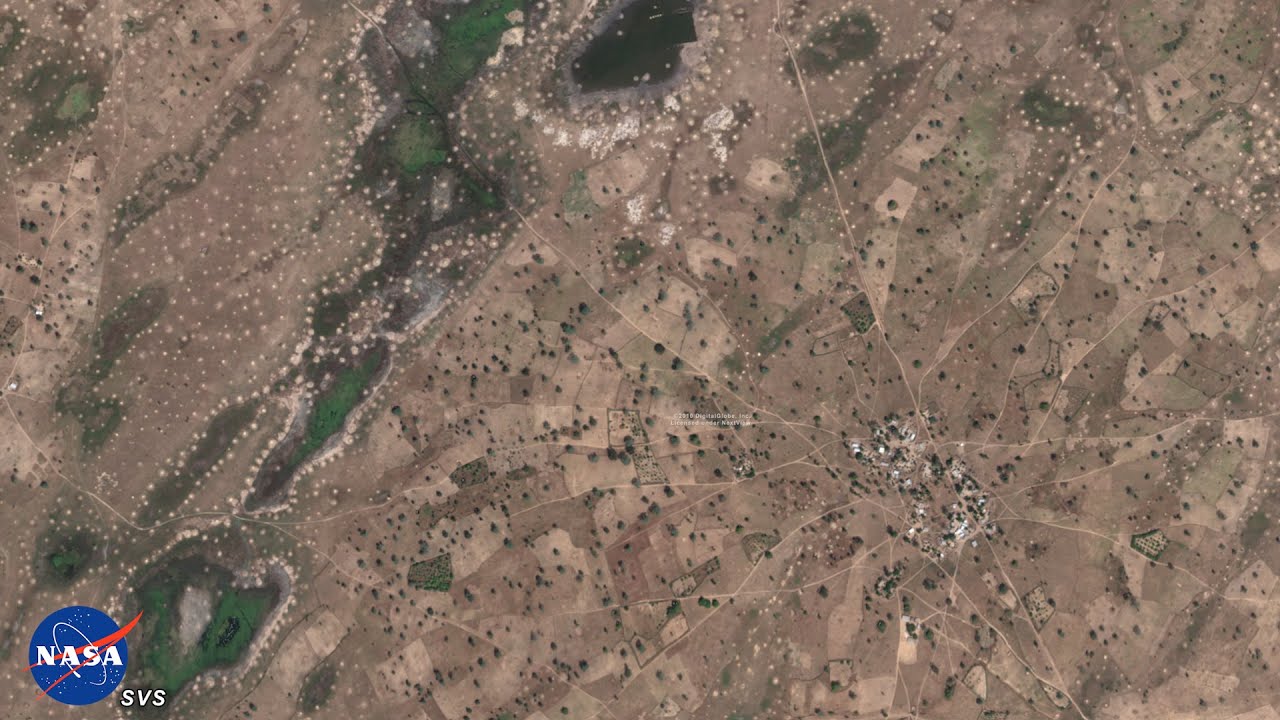


YouTube Description
as posted by the channelSatellites have provided a reliable tool for continuously monitoring changes in the Arctic ice since 1979. Every summer, the Arctic ice cap melts to what scientists call its "minimum" before colder weather begins to cause ice cover to increase.
This visualization shows the expanse of the annual minimum Arctic sea ice for each year from 1979 through 2020, with a graph overlay.
In 2020, the Arctic minimum sea ice covered an area of 3.36 million square kilometers.
Download the video
Links & Promotions
Sentinel Indexing in Progress
Metadata and chapters are available. Claim extraction for this episode is pending.
All video content is delivered via YouTube embedded players in accordance with the YouTube Terms of Service. Sentinel provides research tools that promote discovery and accountability across political media.