Archived Nasa Climate Change
@nasaclimatechange·31.2K subscribers·311 videos
Greenland ice mass loss 2003-2013
Posted
April 27, 2016
Views
13,511
Likes
16
Engagement
0.12%
April 27, 2016
13,511
16
0.12%
Every word spoken in this episode is indexed. Type any phrase to jump straight to the moment it was said.
Type any word or phrase that may have been spoken. Click a result to seek the player to that exact moment.
Try a name, a topic, or a quoted line
 0:10Now Playing
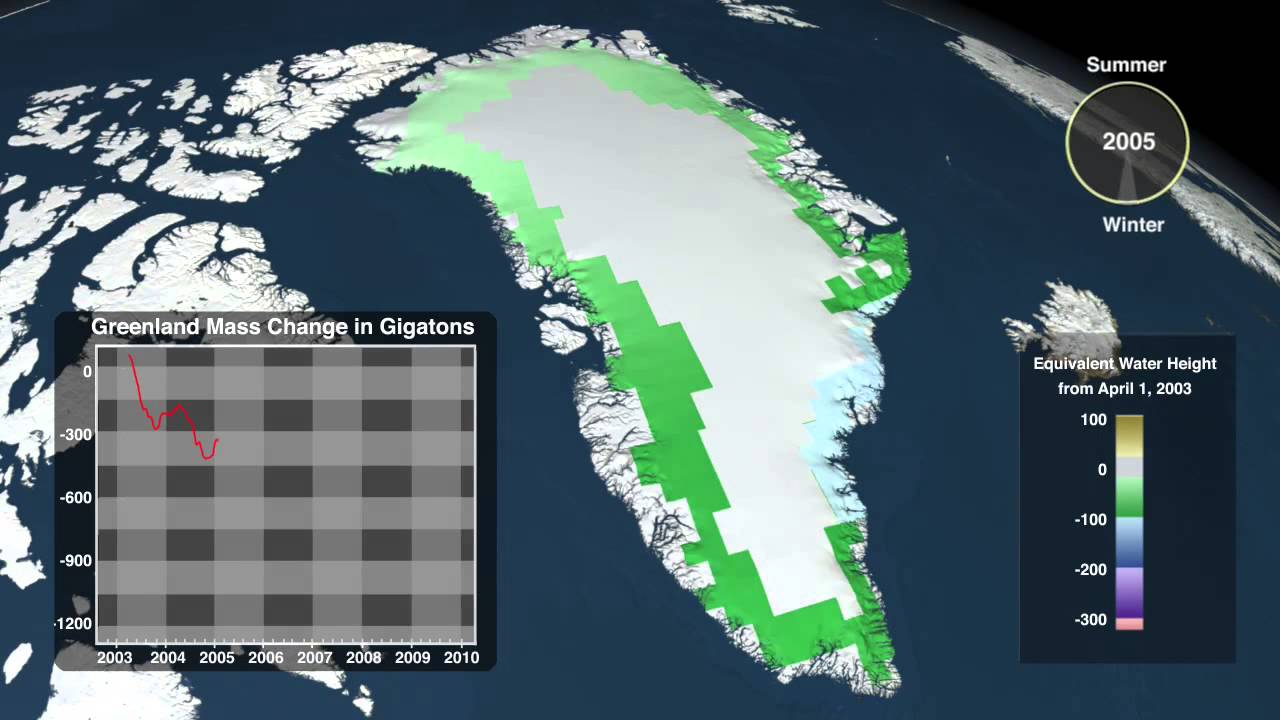
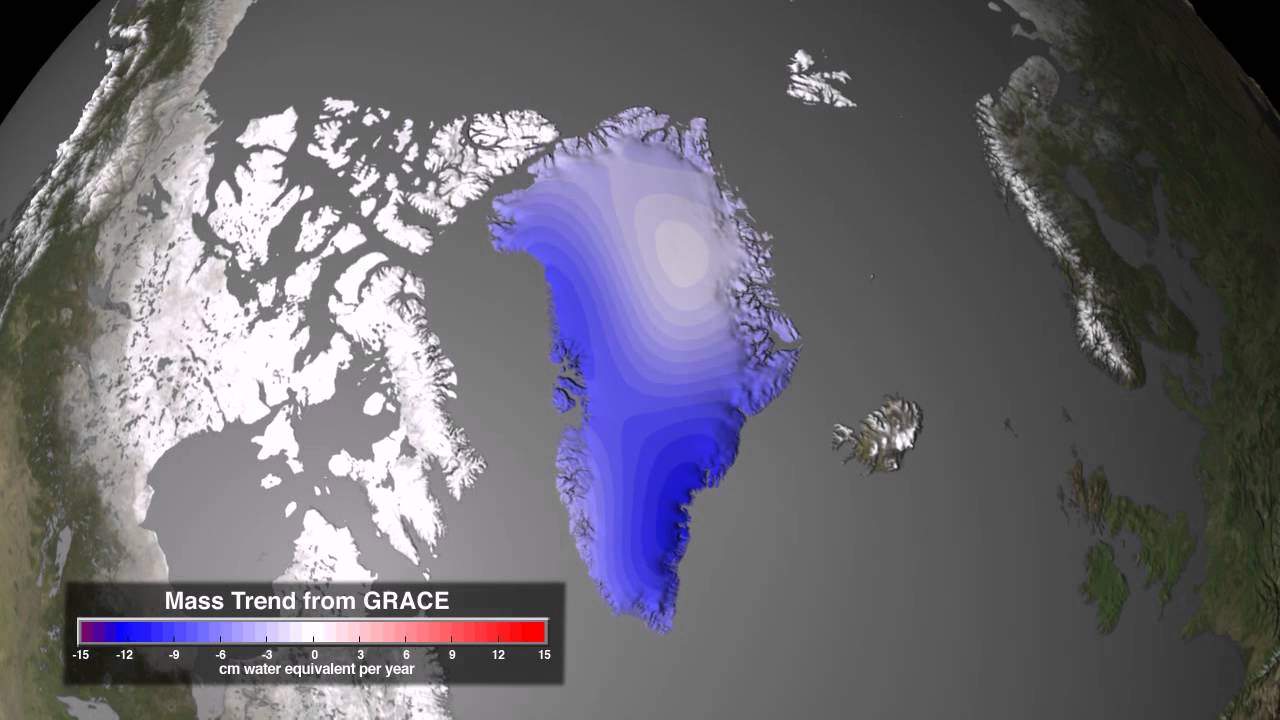
The mass of the Greenland ice sheet has rapidly been declining over the last several years due to surface melting and iceberg calving. Research based on observations from NASA’s twin Gravity Recovery and Climate Experiment (GRACE) satellites indicates that between 2003 and 2013, Greenland shed approximately 280 gigatons of ice per year, causing global sea level to rise by 0.8 millimeters per year. These images, created with GRACE data, show changes in Greenland ice mass since 2003. Orange and red shades indicate areas that lost ice mass, while light blue shades indicate areas that gained ice mass. White indicates areas where there has been very little or no change in ice mass since 2003. In general, higher-elevation areas near the center of Greenland experienced little to no change, while lower-elevation and coastal areas experienced up to 3 meters of ice mass loss (dark red) over a ten-year period. The largest mass decreases of up to 30 centimeters per year occurred over southeastern Greenland.
Download the visualization
Sentinel Indexing in Progress
Metadata and chapters are available. Claim extraction for this episode is pending.
All video content is delivered via YouTube embedded players in accordance with the YouTube Terms of Service. Sentinel provides research tools that promote discovery and accountability across political media.