Archived Nasa Climate Change
@nasaclimatechange·31.2K subscribers·311 videos
Sea level rise 'what ifs' in the southeastern United States
Posted
April 27, 2016
Views
1,854
Likes
14
Engagement
0.76%
April 27, 2016
1,854
14
0.76%
Every word spoken in this episode is indexed. Type any phrase to jump straight to the moment it was said.
Type any word or phrase that may have been spoken. Click a result to seek the player to that exact moment.
Try a name, a topic, or a quoted line
 0:41Now Playing
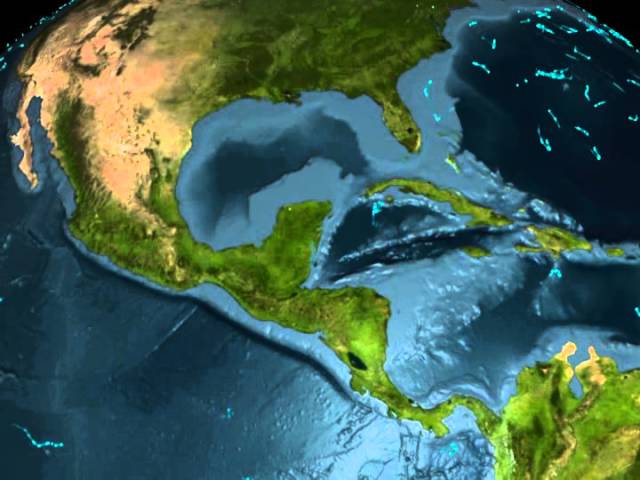
This visualization shows the Southeastern United States with population data over the land. Darker areas over land indicate higher population densities. Sea level scenarios are shown starting with 0 meters of sea level rise (current sea level) and proceeding through 9 meters of rise. Blue areas moving inland indicate where the coastline would be at various levels.
We will likely see some sea level rise in our lifetimes, but the middle-to-higher levels in this visualization are unlikely in the next 100 years.
This visualization is based on Shuttle Radar Topography Mission (SRTM) data. This data primarily measured canopy heights. So, this visualization is showing where water might reach the tops of the trees in various areas.
Credit: NASA/Goddard Space Flight Center Scientific Visualization Studio GRUMP population data provided by CIESIN
Download the visualization
Sentinel Indexing in Progress
Metadata and chapters are available. Claim extraction for this episode is pending.
All video content is delivered via YouTube embedded players in accordance with the YouTube Terms of Service. Sentinel provides research tools that promote discovery and accountability across political media.