Archived Nasa Climate Change
@nasaclimatechange·31.2K subscribers·311 videos
Global temperature anomalies from 1880 to 2018
Posted
February 12, 2019
Views
176,983
Likes
522
Comments
210
Engagement
February 12, 2019
176,983
522
210
0.41%
Every word spoken in this episode is indexed. Type any phrase to jump straight to the moment it was said.
Type any word or phrase that may have been spoken. Click a result to seek the player to that exact moment.
Try a name, a topic, or a quoted line
 0:34Now Playing
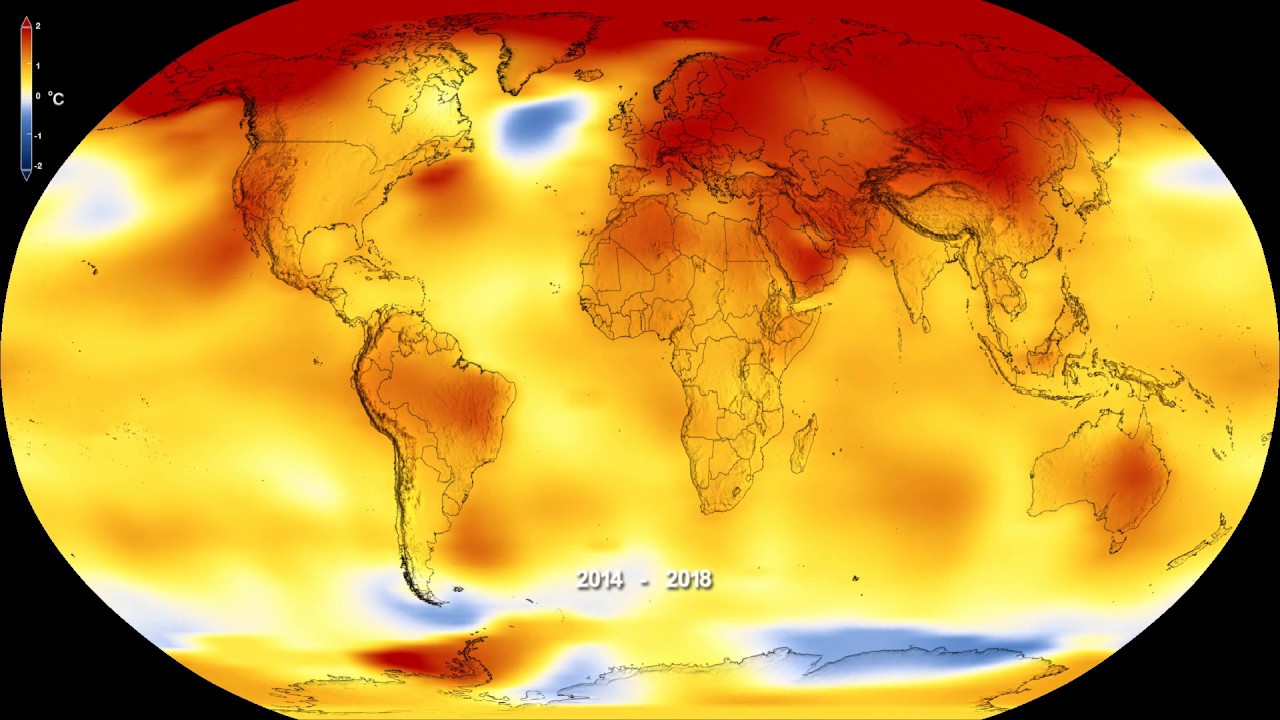
This color-coded map displays a progression of changing global surface temperature anomalies from 1880 through 2018. Higher than normal temperatures are shown in red and lower than normal temperatures are shown in blue. The final frame represents the global temperatures 5-year averaged from 2014 through 2018. Scale in degree Celsius.
Download the video
Sentinel Indexing in Progress
Metadata and chapters are available. Claim extraction for this episode is pending.
All video content is delivered via YouTube embedded players in accordance with the YouTube Terms of Service. Sentinel provides research tools that promote discovery and accountability across political media.